Executive Basketball Stats: Methods Rundown
- 8 minsDocumentation of full analysis
Here I’m trying to set out and summarize my methods for rating executive managers in the NBA. Some of this is for my own benefit since the analytical pipeline code doesn’t lend itself well to high-level documentation internally.
I had to move the pipeline off of AWS with the sunsetting of AWS Cloud9 which I was using as the development and execution environment for this pipeline. I tried Github Codespaces but it doesn’t yet seem to have great support on Firefox. I also tried a Jupyter notebook, but this pipeline is a bit too heavy for something like that so have continued to work off of the command line in Linux.
The Data
For our analysis utilize a transactions database from basketball-reference.com that lists the transactions credited to the NBA executives who were in charge of player personnel decisions.
For each transaction we note if it was a “signing”, “trade” (involving 2 or more teams), or a draft selection. A current limitation is that we do not track outgoing free agent departures, counting them as a sort of negative “signing”.
Each transaction is linked to one or more players, as well as future draft picks.
As noted before, the main stat that we calculate is something I call “Executive BPM”:
Player BPM * Number of minutes played for team
Which gives us a number of (debatable) value that we can use to compare the relative merit of each of an executive’s decisions.
Ernie Grunfeld
As an example, we’ll use the namesake of the project: Ernie Grunfeld. He was an executive at three different teams: the New York Knicks, Milwaukee Bucks, and the Washington Wizards.
{
	'exec_name': 'Ernie Grunfeld',
	'exec_teams': ['NYK', 'MIL', 'WAS'],
	'tenure_years': [
		['1991', '1999'],
		['1999', '2003'],
		['2003', '2019']
	]
}
Each of those tenures had a number of decisions representated by transactions:
# Numbers of transactions recorded by tenure
{'NYK': 68, 'MIL': 32, 'WAS': 187}

# An example transaction
{
	'name': 'Gilbert Arenas',
	'transaction': 'added Gilbert Arenas to WAS',
	'transaction_bpm': 48535.3,
	'transaction_date': datetime.datetime(2003, 8, 8, 0, 0),
	'transaction_direction': 1,
	'team': 'WAS',
	'transaction_id': 100,
	'transaction_type': 'signing',
}
Draft Calculations
Calculating the value of future draft picks
To keep our calculations quick and dirty, we’ll need to make some assumptions about our picks. At some point we could include estimates about guesses about exactly where the pick will lie, which would be great for future lottery picks, but for now we’ll just calculate and include average values for first and second round picks.
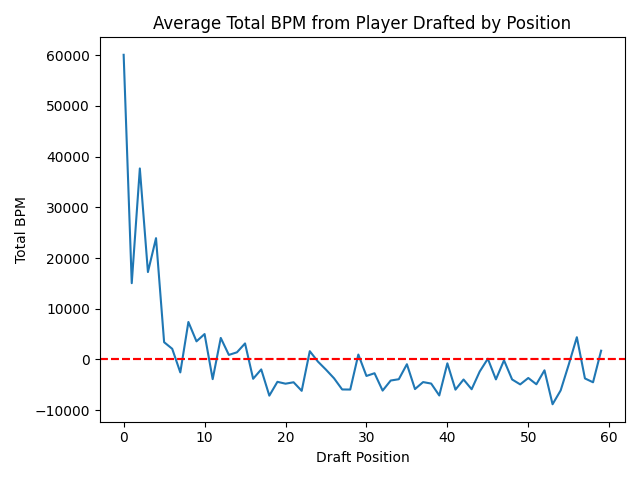
Going back to the very first seasons that we have BPM for (1973) we can calculate the total BPM for every draft pick, and calculate the average value at each draft position.

Funnily enough, the last pick (60th) comes in at positive. This owes to two factors:
- players that never play in the NBA (of which there have been many at the 60th pick) don’t count negatively in the model
- Isaiah Thomas
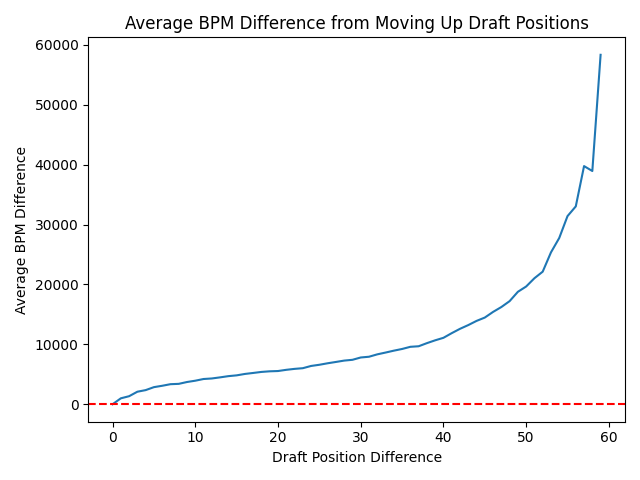
While this chart is useful, what we really want to know is what is the average difference between players at positions with X difference? I.e. what is the average difference between players picked three picks apart? This will be useful for comparing the performance of executives.

Then we can have an average value for both first and second round picks.
avg_first_round_pick_value = 4482.63789898384
avg_second_round_pick_value = -3475.340543872585
Well according to this analysis, second round picks don’t really help teams. Of course, this shows a problem with our model, it assumes executives should always be building the most competitive team they can, and doesn’t account for tanking which is an important strategy. Second round picks might generally not develop into helpful players, but they have value for rebuilding teams who have more bandwith to play and develop players starting from below-average floors.
Similarly for first round picks – lottery picks are extremely more valuable than the picks in the bottom half of the first round. The bottom half of the first round is functionally similar to a second round pick.
>>> avg_first_half_first_round_pick_value
11710.675185347987
>>> avg_second_half_first_round_pick_value
-3004.681368131869
Future steps of improving the model would include making an estimate of the position of a first round pick (whether it is in the lottery or not) based on current team performance – or including a confidence range on the value of the pick.
Executive Ratings
Using the above data, we can try to come up with some useful measures of different aspects of an executive’s performance:
Signing Rating
Even with having calculate ‘Executive BPM’ there are still several ways we can try to use it to measure an executive’s ability.
For example, because Executive BPM is greatly affected from signing or drafting superstar players, we might try to measure an executive’s ability to improve a team on the margins by making a large amount of smaller but smart decisions. So we can calculate a rating based off of a percentage of transactions that were either “good” (resulted in net BPM gain) or “bad” (resulted in net BPM loss). This won’t be a perfect absolute measure, since I haven’t integrated free agent departures in our dataset, but will work as a relative measure for comparing executives.
In Grunfeld’s case, over the course of his career he signed 181 players. However, according to our model, his percentage of “good” signings puts him at the 51th percentile among all the executives profiled, which is decidedly average. If we were grading all the executives on a curve, we’d give him a C.
Trade Rating
This is similar to the signing rating, execpt that we are usually considering more than one player to calculate our net EBPM rating.
One difference is the inclusion of draft picks. Here we add the average value of first/second round picks to the net EBPM of a transaction for considering if it is positive or negative.
Ernie Grunfeld rates here in the 30th percentile, decidedly below-average. On our “curved” rating system we’d give him a D
Draft Rating
This is a bit different, we could just consider total BPM, but an interesting way to quantify an executive’s drafting ability to calculate the relative position of an executive’s draft picks’ value compared to the actual position they were taken in. For example, if a player is taken with the 1st pick of the draft, but is only the 5th best player in the draft, the executive responsible would be picking 4 spots below where they should be in the draft.
To be able to calculate this, we’ll reference our above analysis of draft picks to calculate the average net position benefit of having Ernie Grunfeld draft your players: -3.321429. That means on average Grunfeld was drafting three spots below the pick he was making.
That’s not good, but also not the very worst, as that ranks in the 39th percentile, with a D+ rating. Grunfeld is known for his big busts from his time with the Wizards, like Jan Vesely, but he had some coups over his career such as when at the Milwaukee Bucks he drafted Michael Redd with the 48th pick, who later became an all-star. Most interestingly, the drafting of John Wall is rated as a negative pick since Wall was picked with the first pick of the draft, but only was the second best player of his draft class.
Overall

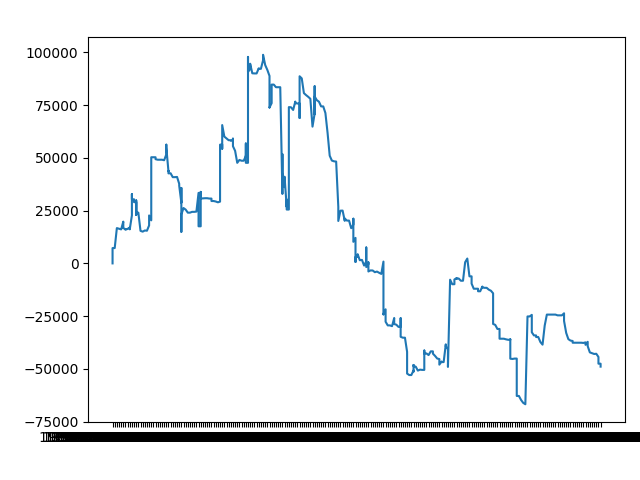
The previous ratings and this hasty chart of EPM over time seem to back up the thesis of this project that Ernie Grunfeld was a mediocre manager who stayed on for too long at the Wizards. He certainly had some high points, but they definitely were not with the Washington Wizards.
Next I’ll take a look at Tommy Sheppard, Grunfeld’s successor in DC who ended up being fired only a few years later. I’d like to compare Sheppard’s tenure directly to Grunfeld’s to see the differences.
In the meantime there are still some TODOs for the analytical pipeline. The biggest priorities are:
- cleaning up the dataset, as the data from basketball-reference.com contains some obvious errors that will need to be fixed.
- finding a way to include free agent departures within the dataset.
- being able to use advanced stats other than BPM would be nice to better gauge transaction.